There I’m
About Me


Welcome to my portfolio! I'm a dedicated Computer Science student at Birla Institute of Technology with a fervent passion for problem-solving and coding. My commitment to delivering excellence drives me to bring 100% to every project I undertake.
In the captivating realms of Web Development and Data Science, I merge elegance with functionality. Crafting intuitive websites and extracting insights from complex datasets, I'm driven by innovation. Each project deepens my understanding of technology's positive impact. Join me in pushing boundaries, creating solutions that matter.
Akash Pandey
+91 8340687066
My Education
Self-driven, quick starter, passionate programmer with a curious mind who enjoys solving challenging real-world problems.
My Skills


I am a skilled MERN stack developer with expertise in MongoDB, Express.js, React, and Node.js. I specialize in building scalable web applications and developing RESTful APIs. I also have experience with data visualization using PowerBI and Tableau, creating interactive visual data representations. My strengths include problem-solving and writing clean, maintainable code.
My Projects


Explore my standout projects, highlighting my proficiency in Web Developement and Data Analytics.Each project showcases my ability to deliver innovative solutions and achieve exceptional results. Dive in to see my technical skills and creativity at work.
Project Details
Rule Engine with AST, developed using MySQL, Next.js, and Flask, efficiently parses and evaluates complex logical conditions, offering a modular, scalable solution for dynamic rule processing and decision-making.
The Rule Engine with AST (Abstract Syntax Tree) is a modular and efficient solution for evaluating complex logical conditions, making it ideal for dynamic rule processing and decision-making in various applications. This engine leverages a structured parser to convert inputs into ASTs, enabling fast and reliable condition evaluation.
Key features include:
Modular Parser: Transforms complex string inputs into an AST format for efficient processing.
Condition Evaluation: Supports complex logical and mathematical condition evaluation with accuracy.
User-Friendly Interface: Intuitive UI for managing and testing rules dynamically.
Error Handling: Robust error-catching mechanisms for seamless rule parsing and execution.
Deployment Ready: Packaged within a Docker environment for cross-platform compatibility and easy deployment
Test Coverage: Over 80% test coverage with comprehensive unit tests for various edge cases.
Integration Capabilities: Easily integrates with APIs and supports backend frameworks for extended functionality.
Tech Stack Used:
Client Side : React.js + Next.js
Server Side : Node.js + Express.js
Database: MySQL
API Communication: RESTful APIs
Containerization: Docker
Development Tools: ESLint for linting, Postman for API testing and documentation
Project Details
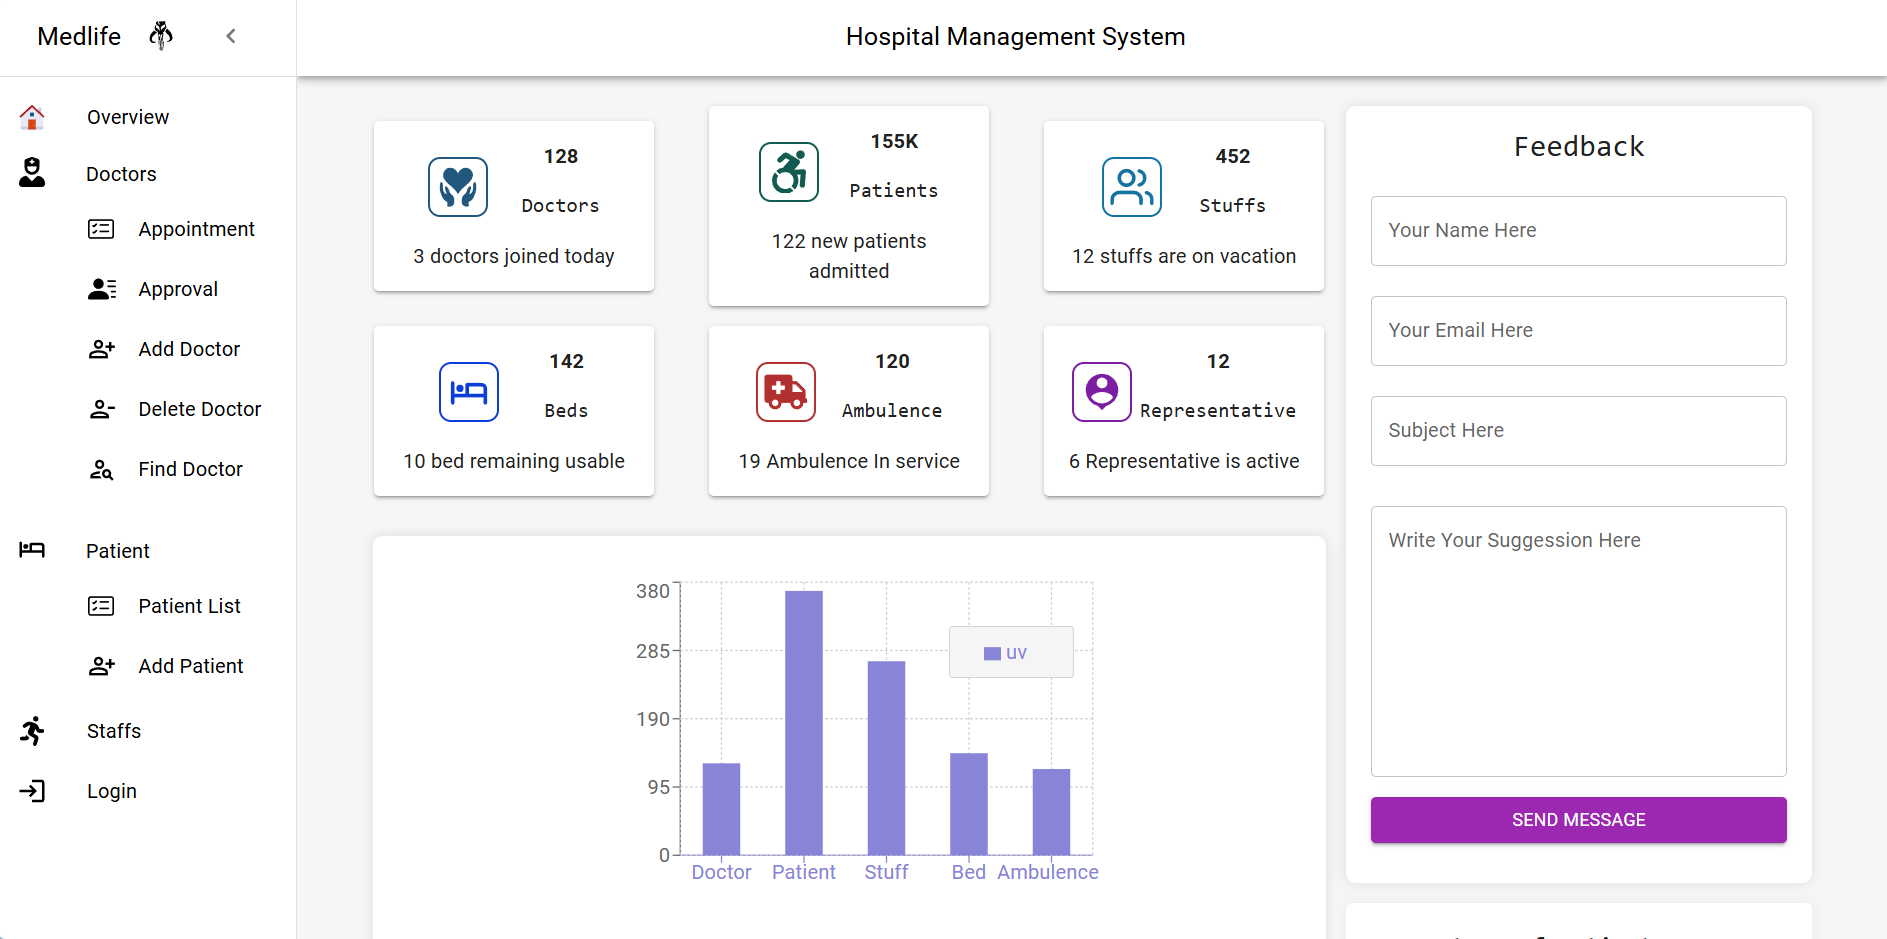
Hospital Management System, developed using the MERN stack (MongoDB, Express.js, React, and Node.js), offers a robust and efficient solution to streamline hospital operations.

Hospital Management System is a comprehensive, user-friendly solution designed to streamline and optimize the management of hospital operations. This system integrates various essential functions, ensuring efficient patient care, resource management, and administrative processes
Key features include:
User Authentication: Secure login and logout functionality for different user roles.
Doctor Management: Easily add, update, and manage doctor profiles and schedules.
Patient Management: Maintain detailed patient records, including personal information, medical history, and treatment plans.
Ambulance Management: Track and manage ambulance details and availability.
Appointment Scheduling: Book, manage, and approve patient appointments with ease.
Approval System: Ensure proper authorization and approval processes for various hospital operations.
Tech Stack Used:
Client Side : React Js + Vite
Server Side : Mongo DB , Node Js
Linting Tool : EsLint Js
Project Details
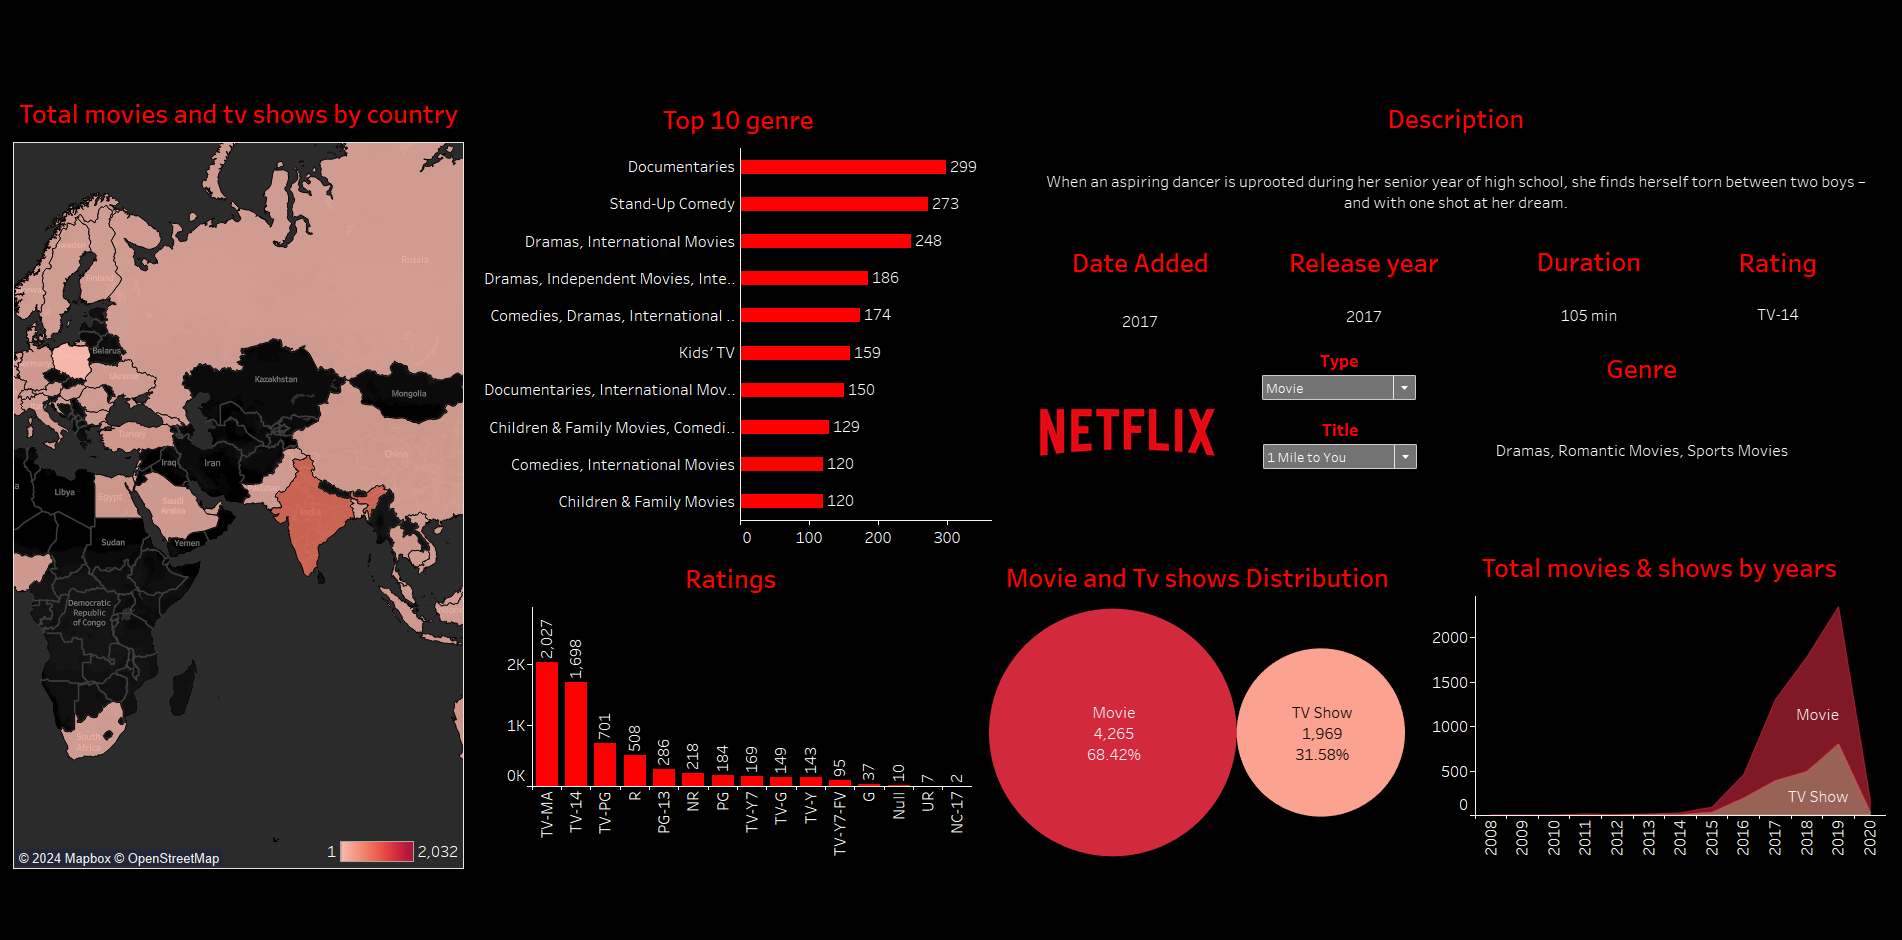
I developed a Netflix Data Set Visualization dashboard to dynamically analyze and display various data patterns, providing insights into viewing trends, genre popularity, and more.

The dashboard offers interactive visualizations that allow users to explore various data patterns, uncovering insights such as the most popular genres, viewing habits over time, and the geographical distribution of Netflix content. This project demonstrates my proficiency in data analysis and visualization, making complex data accessible and engaging.
Here are its main functions:
Total Movies and TV Shows by Country: Discover the geographical distribution of Netflix content.
Top 10 Genres: Identify the most popular genres across the platform.
Ratings: Analyze the ratings distribution to understand viewer preferences.
Movies and TV Shows Distribution: Examine the balance between movies and TV shows.
Total Movies and Shows by Year: Track the yearly release trends of Netflix content.
Content Details: View detailed information on description, release year, duration, genre, and titles.
Tech Stack used:
Dataset & Extraction : Python , Kaggle
Transformation : Microsoft Excel
Loading And Presentation : Tableau
Project Details
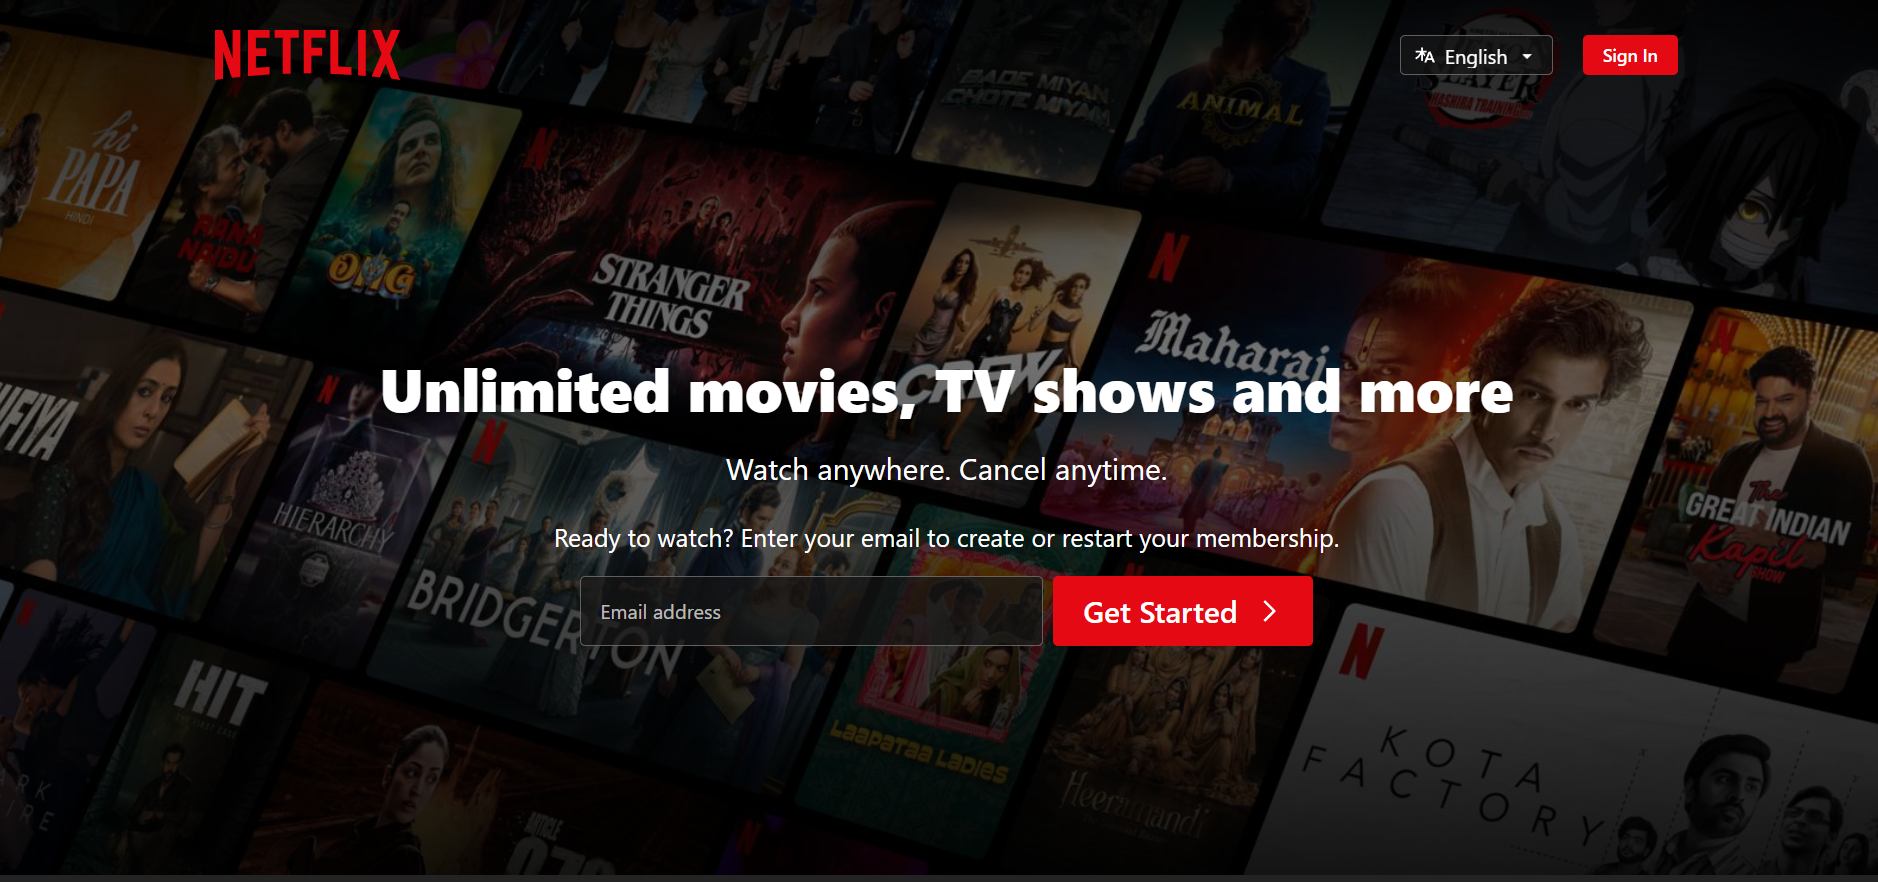
Created a Netflix Clone using the MERN stack (MongoDB, Express.js, React, Node.js), featuring user authentication, dynamic content loading, and a responsive interface for an immersive streaming experience.

It replicates Netflix's core functionalities, offering secure user authentication, dynamic content loading, and a responsive interface. Users can browse, search for movies and TV shows, view detailed descriptions, and enjoy smooth streaming. This project highlights my full-stack development skills, integrating a robust back-end with a sleek, user-friendly front-end.
It includes the following functionalities:
User Authentication: Secure login and logout features.
Dynamic Content Loading: Efficiently loads content for an improved user experience.
Responsive User Interface: Adapts to various screen sizes for accessibility on different devices.
Browsing and Searching: Allows users to easily browse and search for movies and TV shows.
Detailed Descriptions: Provides comprehensive details and descriptions for each title.
Seamless Streaming Experience: Ensures smooth and uninterrupted streaming.
Tech Stack Used:
Client Side : React Js
Server Side : Mongo DB , Node Js , Postman
Linting Tool : EsLint Js
Project Details
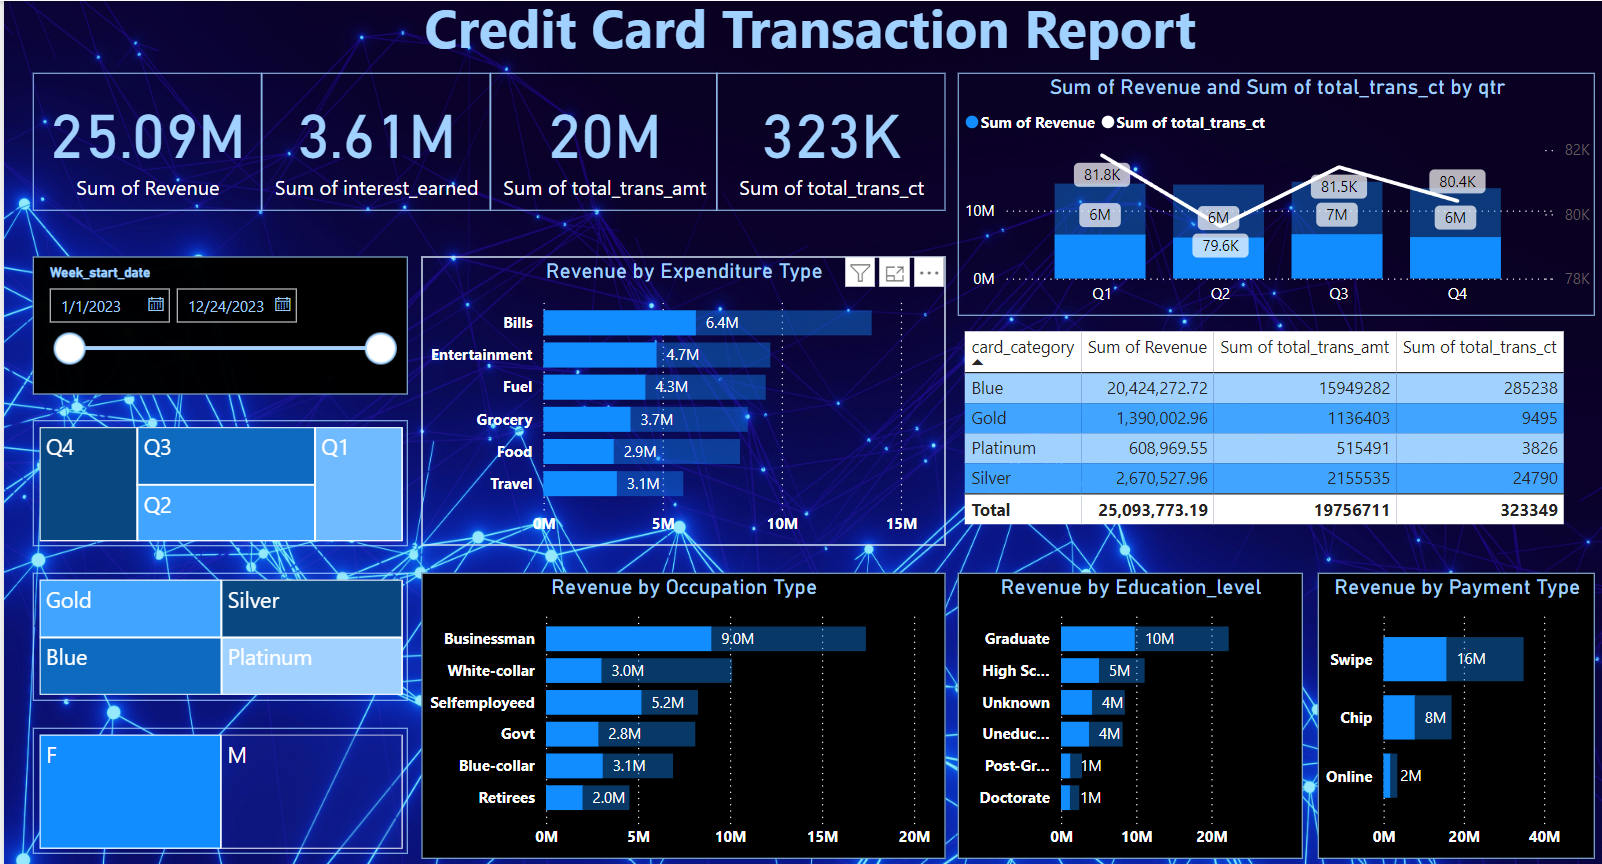
The Credit Card Data Visualization project is a powerful tool designed to provide clear and insightful visual representations of credit card transaction data

This project employs advanced data visualization techniques to help users easily understand spending patterns, detect anomalies, and make informed financial decisions. Featuring interactive charts, graphs, and dashboards, this project demonstrates my proficiency in data analysis and visualization, offering a comprehensive view of credit card usage and trends.
Here are its standout features:
Total Revenue: Displays the overall revenue generated from all transactions within a specified period.
Total Interest Earned: Shows the total amount of interest earned from all credit card accounts.
Total Transaction Amount: Summarizes the total monetary value of all transactions processed.
Total Transactions Count: Counts the total number of individual transactions conducted.
Sum of Sales by State: Breaks down the total sales amount by each state, providing geographical insights.
Sum of Revenue and Transaction Count per Quarter: Analyzes the revenue and transaction volume on a quarterly basis.
Revenue by Expenditure: Compares revenue against various categories of expenditures to identify trends.
Revenue by Education Level: Highlights revenue generated from customers with different educational backgrounds.
Revenue by Payment Type: Categorizes revenue based on different payment methods used, such as credit, debit, or digital payments.
Tech Stack Used:
Data Extraction: Kaggle, PostgreSQL
Data Transformation: Excel, Power BI
Data Loading and Presentation: Power BI
Internships


Delve into my internship experiences, where I have honed my skills in Data Analytics and MERN Development. Each role showcases my adaptability, proactive contributions, and professional excellence. Discover how I’ve applied my knowledge to tackle real-world challenges and gained valuable insights that have propelled my career forward.
Internships
I am currently a Data Analyst and Visualizer Intern at Airtel Digital, where I leverage data analysis and visualization techniques to uncover insights and support strategic decision-making.
Data Cleaning: Ensuring data quality by cleaning and preprocessing raw data for accurate analysis.
Exploratory Data Analysis (EDA): Conducting thorough analyses to identify trends, patterns, and anomalies in the data.
Interactive Dashboards: Designing and developing interactive dashboards that present data in a visually compelling and easily understandable manner.
Stakeholder Collaboration: Working closely with stakeholders to understand their data needs and provide actionable insights.
Reporting: Creating detailed reports that summarize findings and recommend data-driven actions.
Tool Utilization: Utilizing advanced tools and technologies for data analysis and visualization, such as Python, SQL, and Tableau.
Send A Hello!👋
I'd love to start a conversation with you.